The history of publishing delays
2016-02-10Last June, I released a summary of the recent publishing delays at 3,475 journals. The post attracted lots of attention via Twitter and Nature News, primarily because scientists are frustrated with the sluggish pace of publishing.
However, a major question remained. Are publication delays getting shorter or longer? Kendall Powell, writing a feature for Nature News released in tandem with this post, contacted me. Her investigation had uncovered a widespread belief that delays were worsening with time. But she wanted data, and the existing data was field specific or anecdotal.
So I set out to uncover the history of publishing delays. Using PubMed, I extracted
- acceptance delays—days from receival to acceptance—for 3,330,333 articles since 1965
- publishing delays—days from acceptance to online publication—for 2,765,750 articles since 1997
through the end of 2015. PubMed relies on publishers to deposit history dates. Frequently, publishers opt not to provide histories, and occasionally they provide erroneous dates. As a result, publishing delays for many journals will be missing or incomplete.
Acceptance delays
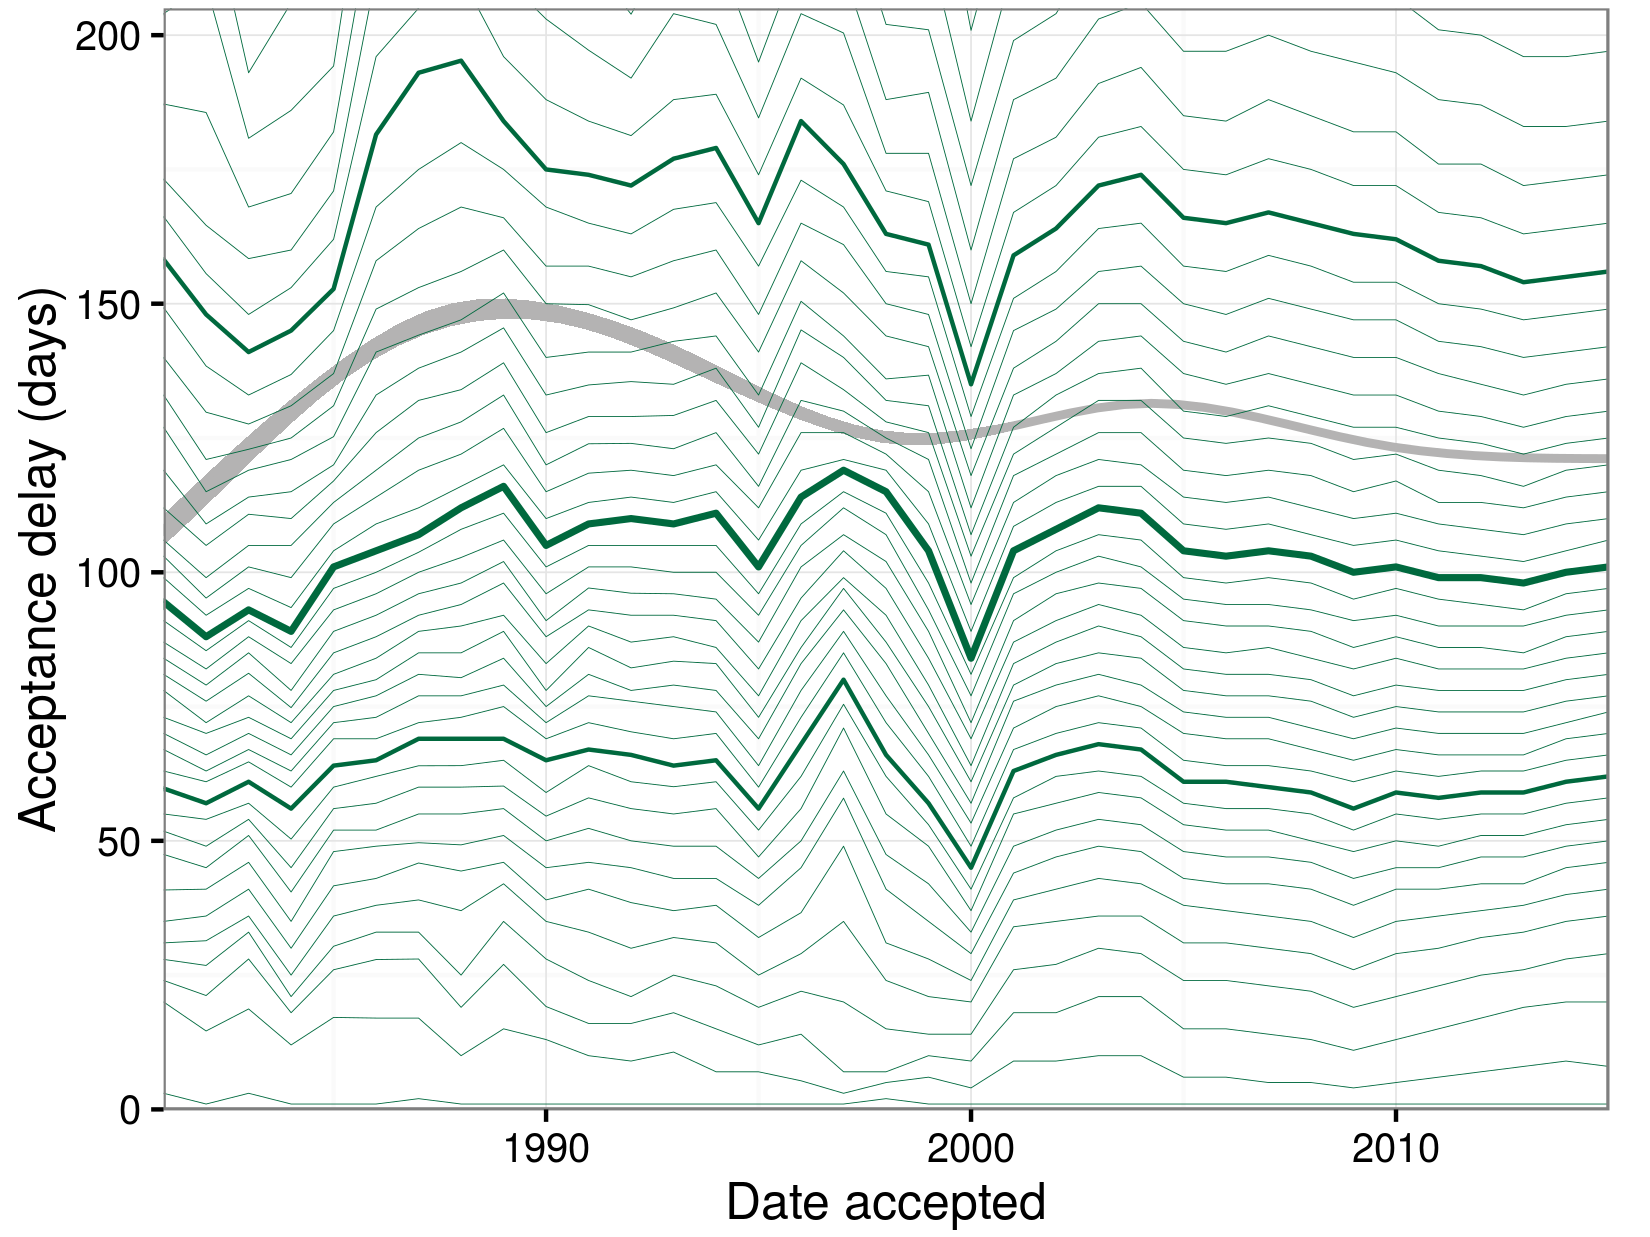
The time between submission and acceptance encapsulates editorial decision, peer review, and revision. Below, we visualize 35 years of acceptance delays. Each year, the green lines indicate delay percentiles, spaced every 2.5 points with quartiles bolded. The gray band displays a curve fitted for all articles over time.

The number of journals reporting acceptance delays prior to 1981 is in the single digits, so drawing conclusions on those early years would be premature. However since 1981, the median acceptance delay has teetered around the 100 day mark. So on a per article level, acceptance delays don’t appear to be worsening. If anything, long delays are becoming less frequent as evidenced by the downward sloping third quartile line and best-fit curve since 1988.
Interested in a specific journal? Use the box below to select from 3,086 journals with acceptance delay histories. Red dots represent individual articles.
Publication delays
Online publication began in the ’90s and quickly became standard. Nowadays, since print rarely precedes online access, an article’s online debut is its effective date of publication. Conveniently in PubMed, precise dates are considerably more available for online compared to print publication.
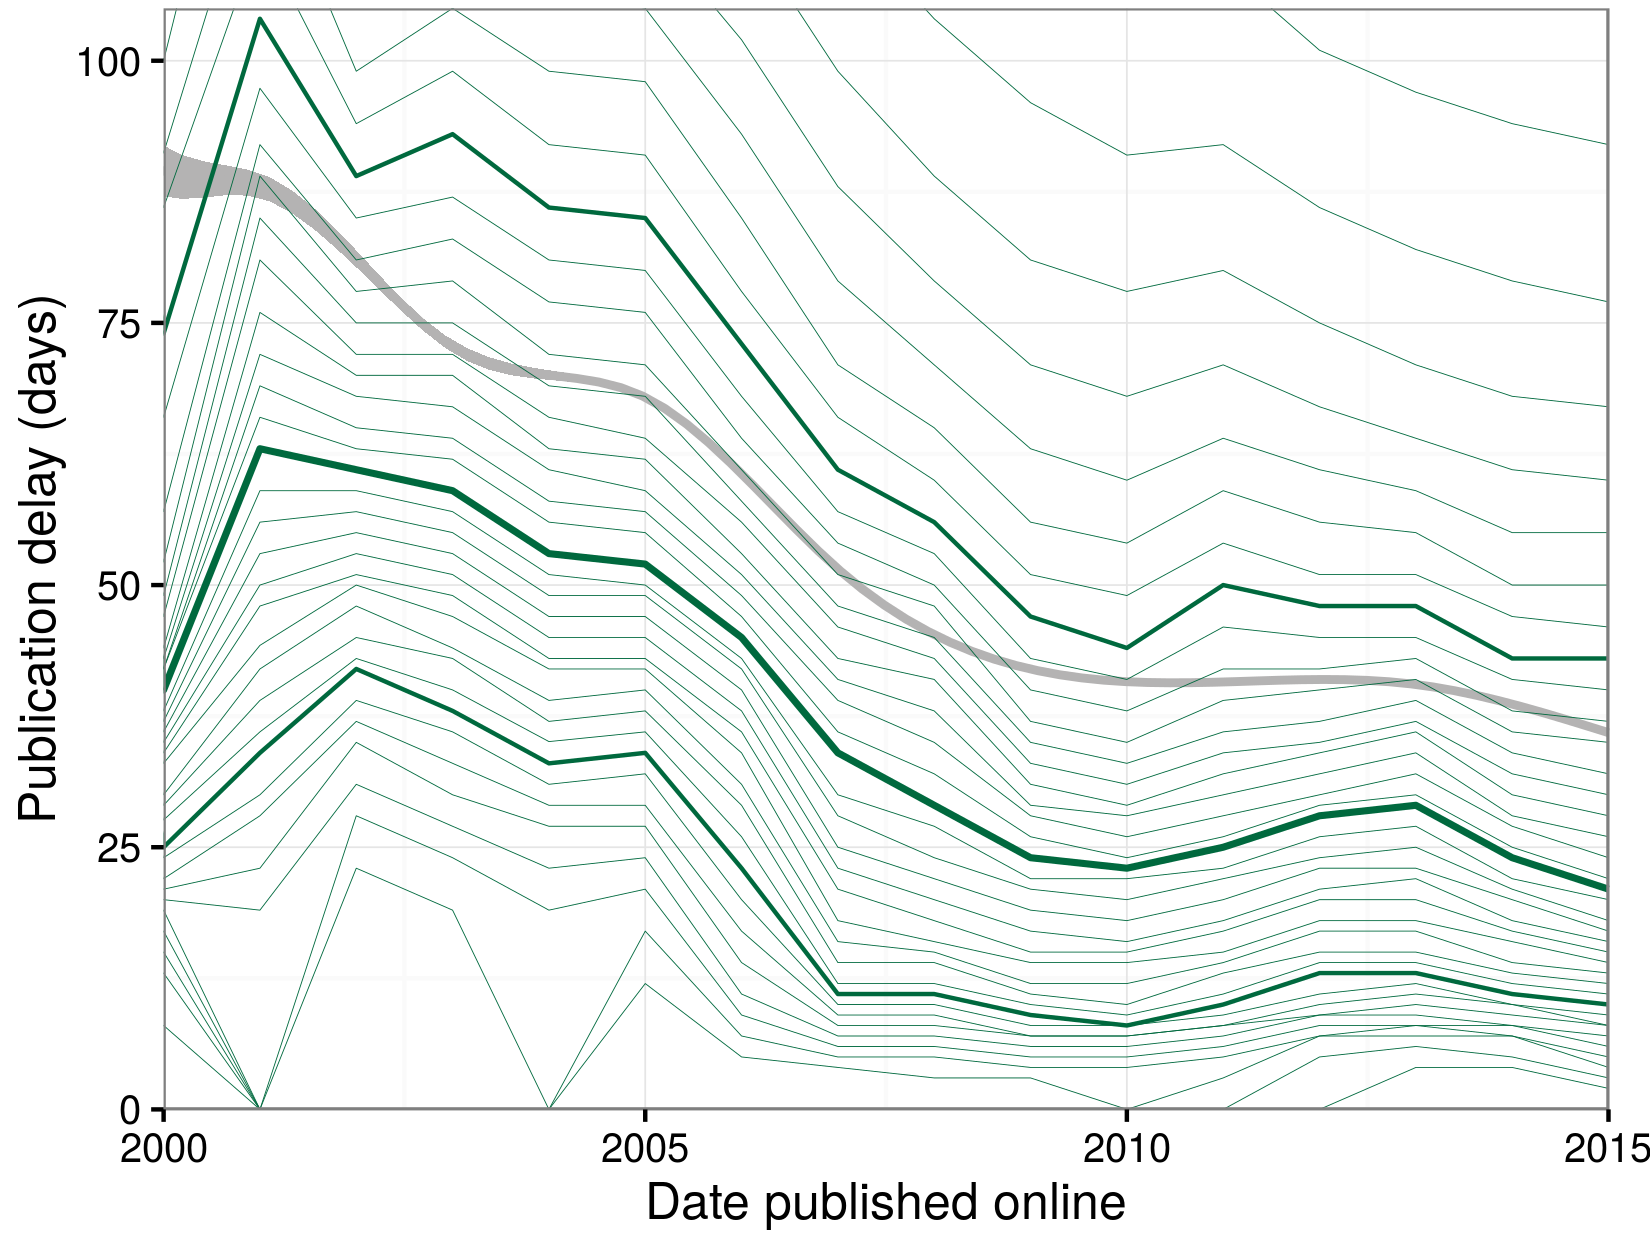
The time between acceptance and online publication encapsulates typesetting, proofing, and occasionally press releasing. The plot below shows the history of online publication delays since 2000, the first year with a double-digit number of journals.

Publication delays have approximately been cut in half since the early 2000s. Progress hit a plateau in 2009 with the median delay stabilizing around 25 days. However, the longest delays steadily decreased up until 2014.
These findings illustrate the transformative power of the digital age: publication speed doubled and now greater transparency will bring scrutiny to the stragglers, who will hopefully pick up their pace. Below, select from 2,756 journals with publication delay histories.
Journal trends
The last decade witnessed the rise of the megajournal. By rapidly publishing a large quantity of articles, megajournals could be driving article-level delay trends. So what about journal-level delay trends? If you select a random journal, are you more likely to see increasing or decreasing delays?
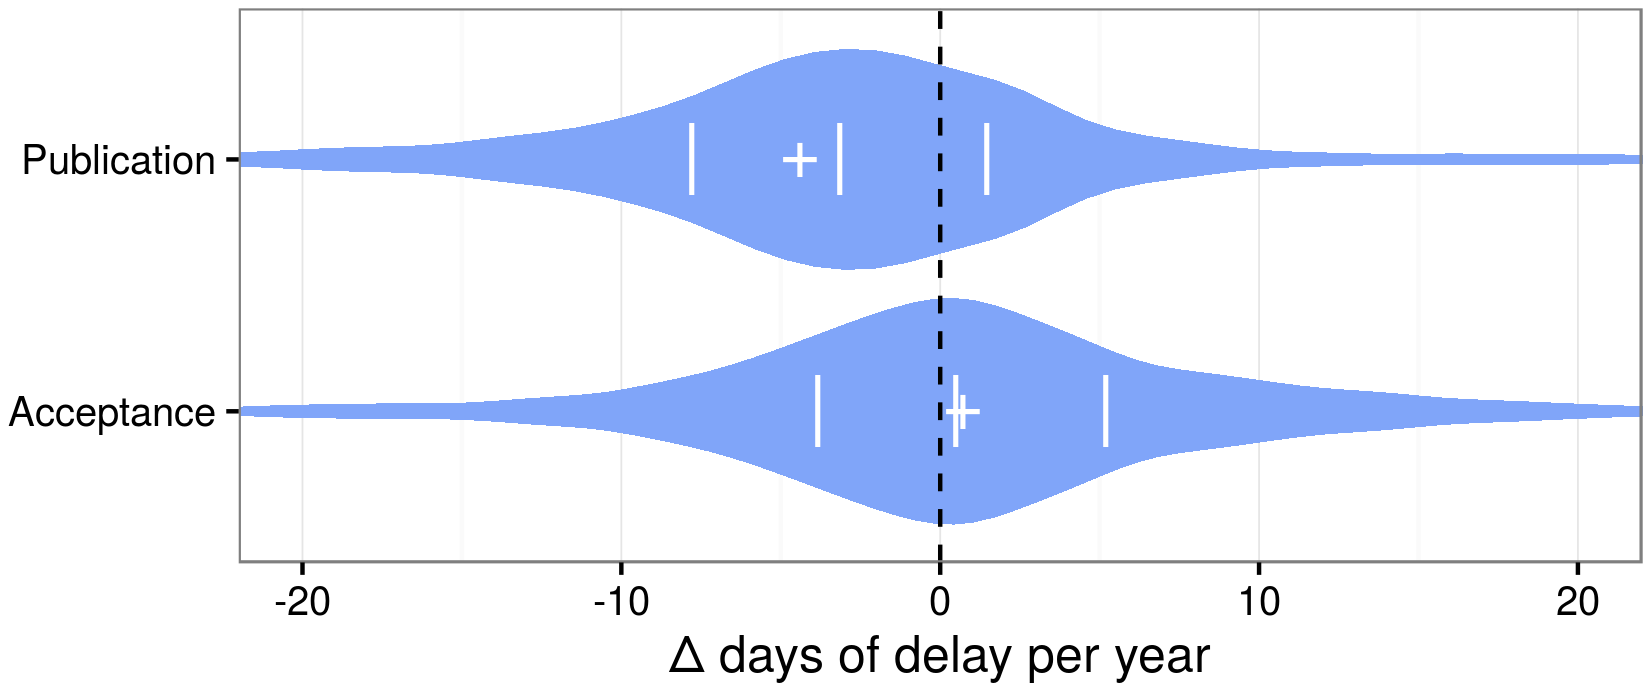
For each journal, I regressed article delay versus date. The resulting slope indicates the average number of days a journal’s delays increased per year. The distributions of these slopes are shown below. Dashes indicate quartiles and crosses indicate means.

69% percent of journals experienced decreasing publication delays. However in terms of acceptance delays, journals were roughly split between quickening and slowing. These findings suggest that the article-level trends above are generally occurring amongst journals, rather than being dominated by a few megajournals.
Limitations
Briefly, here are some limitations the reader should be aware of:
- PubMed contains erroneous dates. However, we apply quality controls such as removing negative delays and zero-day acceptances.
- Depositing dates in PubMed is optional leading to the potential for selection bias.
- The overall time till publication is outside the scope of this analysis. Growing manuscripts, rejection rates, and author lists could make the overall publication process more laborious even if individual journals are becoming quicker.
- There is no standard for PubMed’s
receivaldate. Some journals use the date of initial submission while others use resubmission or revised-submission dates. - There’s evidence that journals favor decisions of “reject and resubmit” rather than “revise” to shorten their reported acceptance delays. Some feel this practice is increasing with time.
- Provisional publication—whereby publishers release a pre-typeset article (generally as a PDF only) prior to complete online publication—blurs the meaning of publication.
The takeaway here is that, as a whole, PubMed acceptance delays likely underestimate the actual time it takes to get a manuscript accepted. I encourage readers to explore and build on this analysis, which is available on GitHub and citeable via DOI: 10.5281/zenodo.45516.
Conclusion
Publishing delays haven’t ballooned. However, there’s plenty of room for improvement. I’d like to see existing journals strive towards acceptance within two months and publication within two weeks. In the meantime, scientists looking to circumvent delays should consider preprinting or realtime platforms such as Thinklab.
